Market Flow board
Every F&O stock on one screen: how many are up versus down, which sectors are leading and lagging, each stock’s path since 09:15, and the strongest 20 on each side. Switch to NIFTY 50, BANK, IT or any of 17 indices.
Live NSE market structure, from your Kite account
Sector flow, order blocks, liquidity sweeps and order flow for every F&O stock, explained in plain English. Built for active traders who want to understand the move, not chase tips.
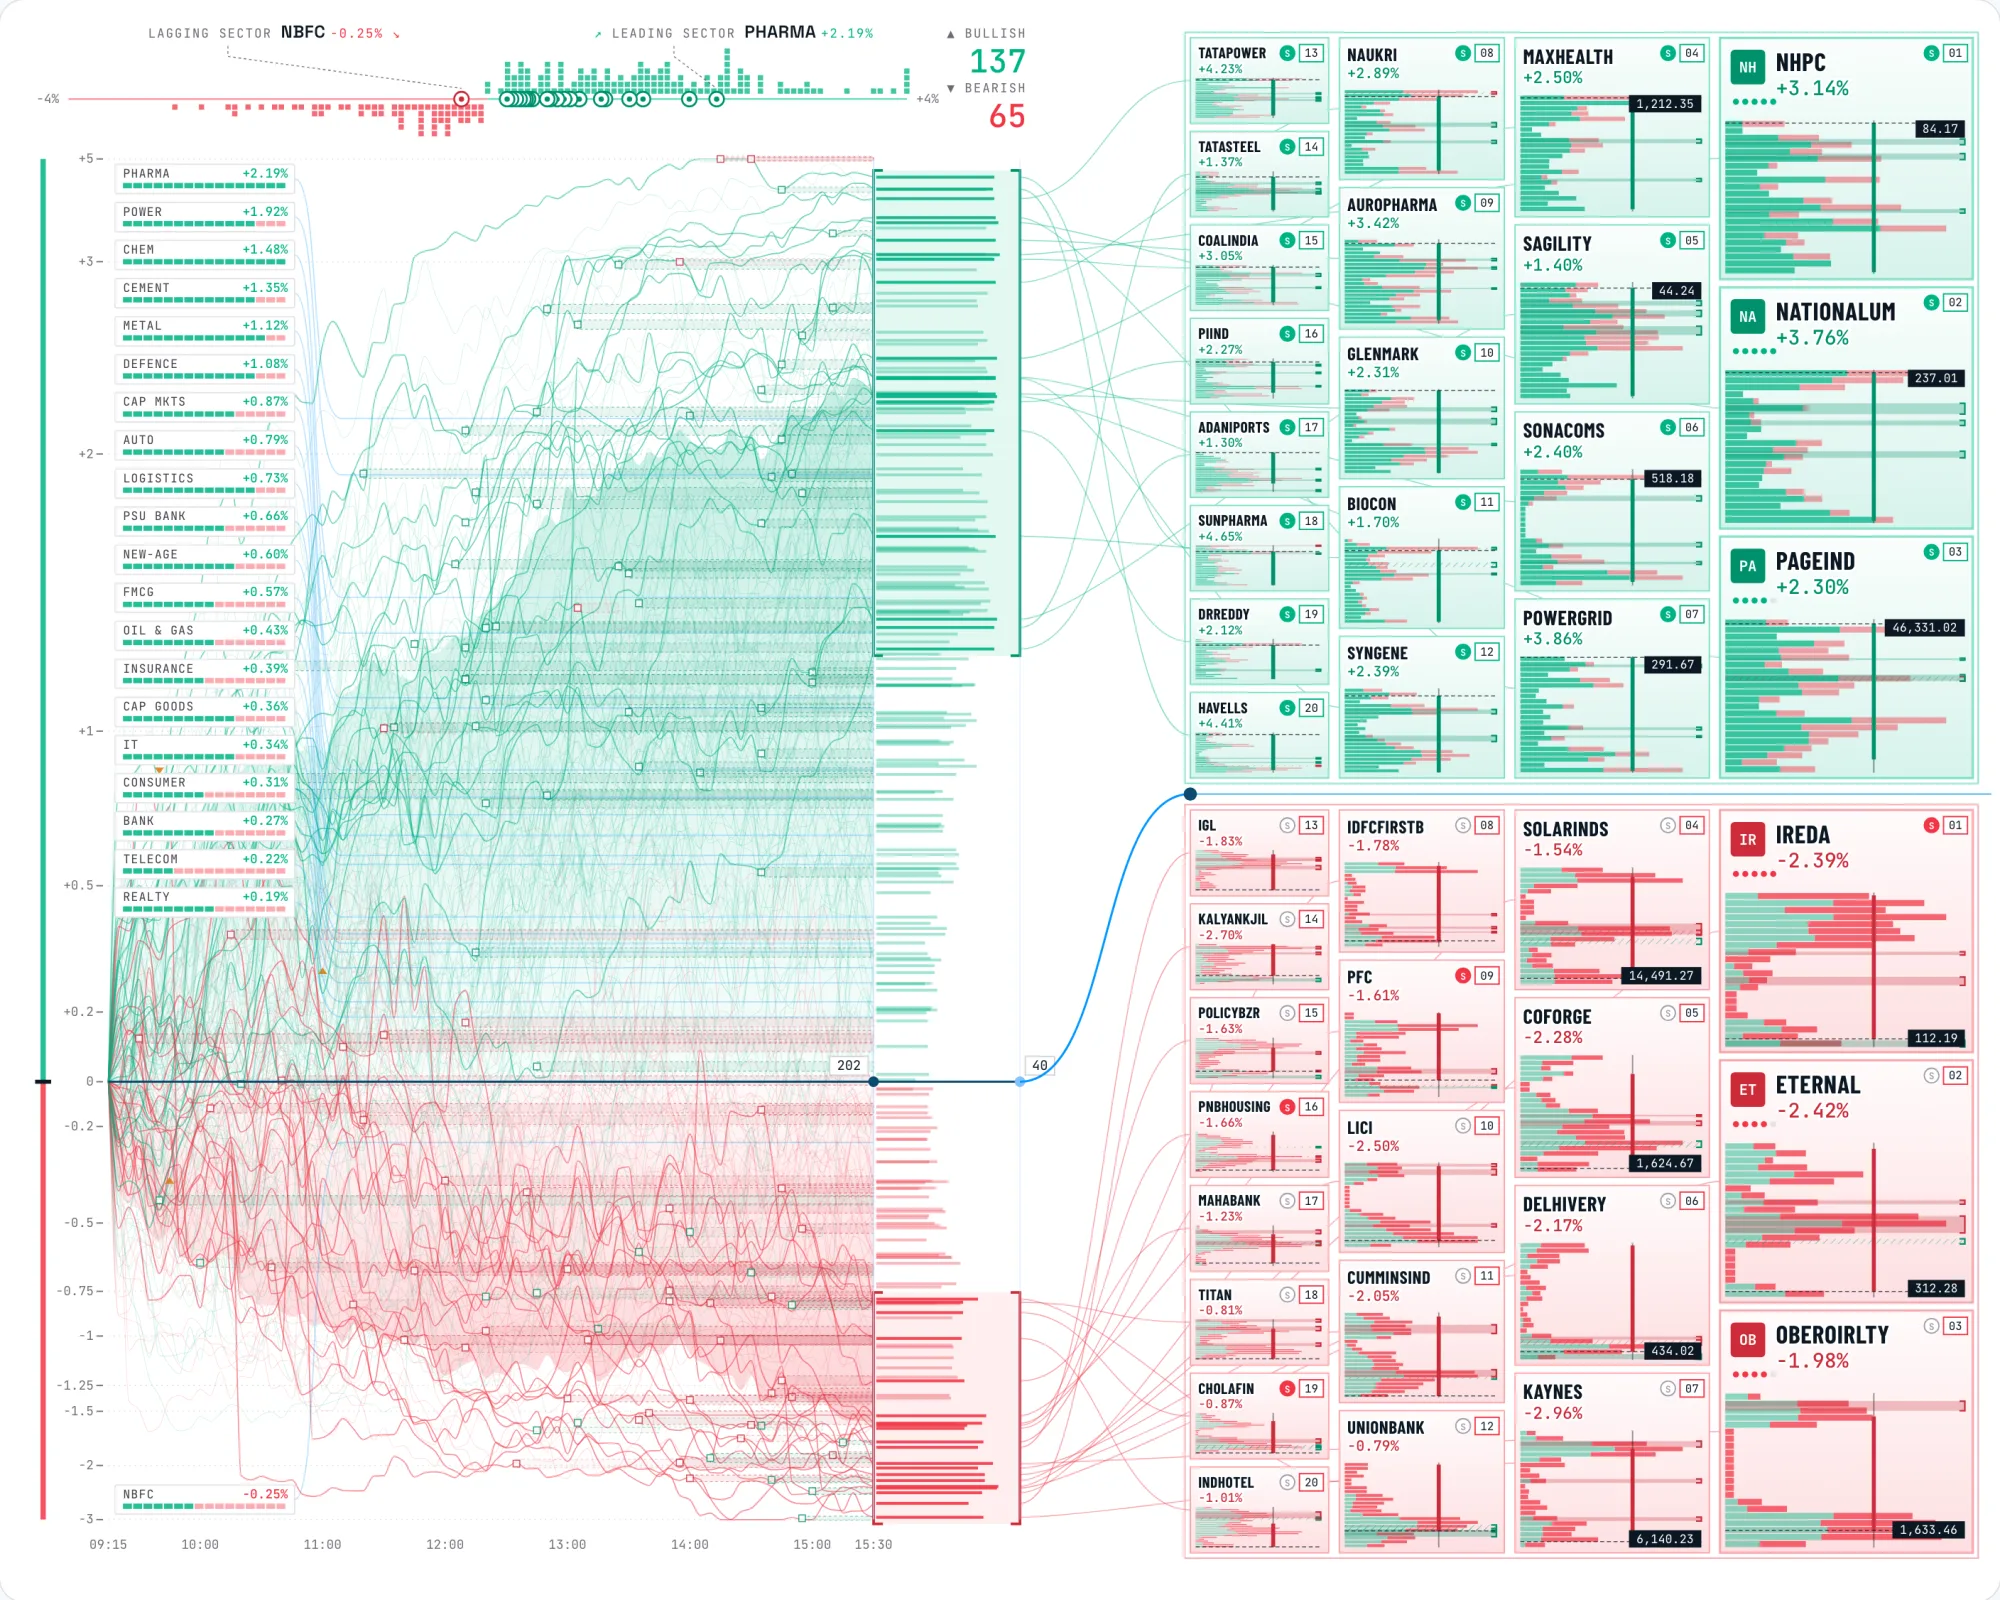
Market Flow board (simulated session)
What you get
Everything is calculated live from 5-minute candles and ticks, and every number comes with what it means.
Every F&O stock on one screen: how many are up versus down, which sectors are leading and lagging, each stock’s path since 09:15, and the strongest 20 on each side. Switch to NIFTY 50, BANK, IT or any of 17 indices.
The footprints large orders leave: the last opposite candle before a sharp push, and the moments price runs past yesterday’s high, the opening range or the day’s extremes, triggers the stops resting there, then snaps back.
From live ticks, how much volume was buyer- versus seller-initiated in every 5-minute bar, plus the running total. When flow disagrees with price, the move is often being absorbed.
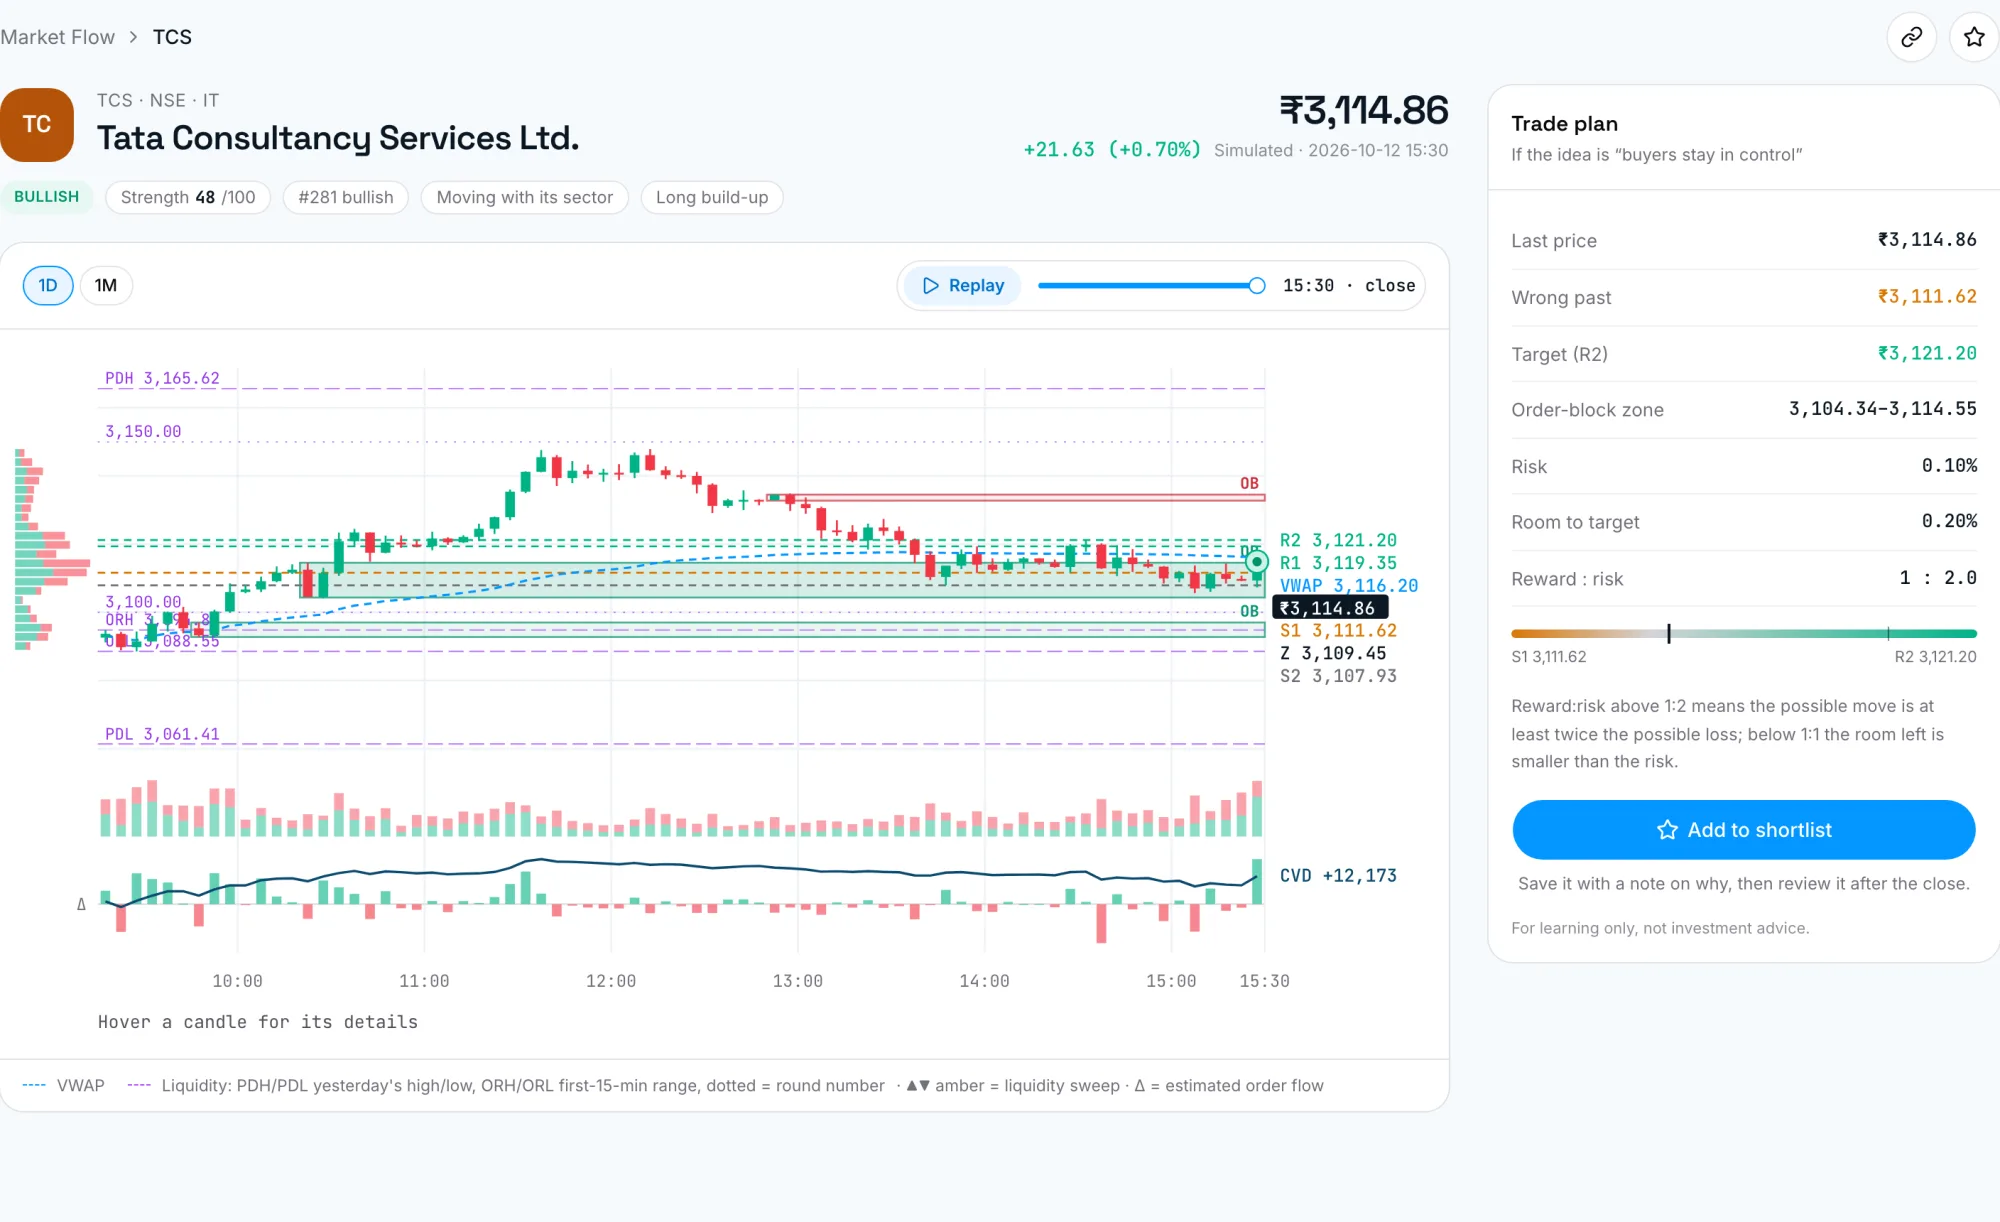
Nearest support and resistance, the zone, where the idea is proven wrong, the room to the next level and the reward-to-risk, alongside a plain-English read of the trend, sector, size and open interest.
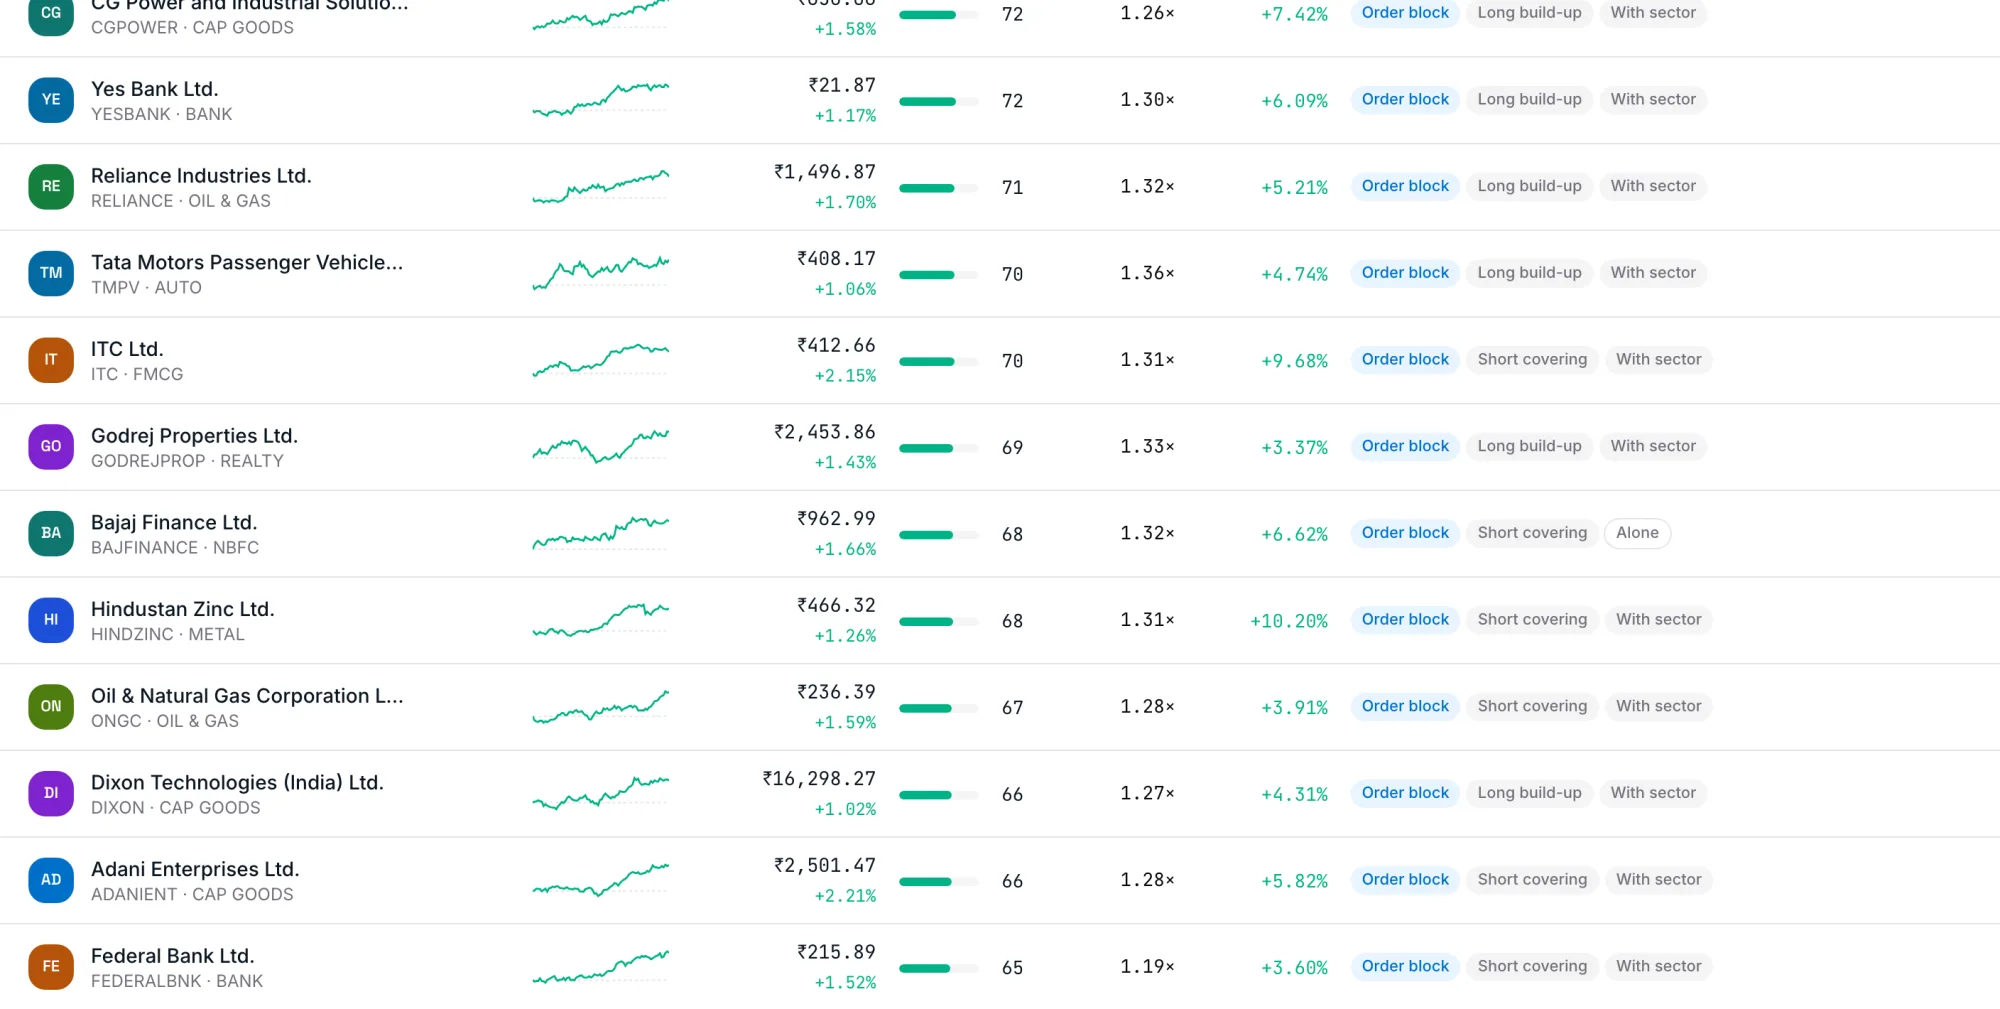
Ranked lists for the day: strongest bullish and bearish, fresh sweeps, volume shockers and order-flow leaders, each with a sparkline, strength score and the signals behind it.
Save a stock with the reason you picked it, see how it moves after, and review it after the close. Writing down why is how you learn which reasons actually work.
Every stock in depth
5-minute candles with VWAP, order blocks, support and resistance, yesterday’s high and low, the opening range and round numbers, volume and order flow underneath. Next to it, the trade plan: where the idea is wrong, the next level, and the reward for the risk.
Movers
Strength blends the move against the stock’s usual daily range, volume versus normal, holding above or below VWAP, and whether open interest confirms fresh positions. Each row shows the signals behind its score.
Sign in to MoneyHQ, then click Login with Kite. You sign in on Zerodha’s own page; MoneyHQ receives a market-data session, never your password.
From 09:15 the board, movers and stock pages update every few seconds as candles and ticks arrive. Before the open, you see the last session.
Hover any stock for a plain-English read, open its page for the levels and the plan, and keep a journal of what you picked and why.
Learn
Market structure · 6 min read
What an order block is, why price often reacts when it returns to one, and when a zone stops mattering.
Market structure · 7 min read
Why price pokes past obvious highs and lows, what it means when it snaps back, and what a failed sweep tells you.
Order flow · 8 min read
How MoneyHQ estimates buyer- and seller-initiated volume from live ticks, what cumulative delta shows, and the limits of an estimate.
For live data, MoneyHQ connects to Zerodha’s Kite Connect. You log in on Zerodha’s own page, so MoneyHQ never sees your Zerodha password. Without a live connection the app runs on a realistic simulated session, so you can learn how to read it.
No. MoneyHQ does not place orders, manage money or recommend buying or selling anything. It shows and explains what the market has done today. Decisions, and their risks, are yours.
NSE stocks: the F&O universe plus the members of 16 NSE indices, around 500 stocks, on 5-minute bars from 09:15 to 15:30 IST.
It is an estimate. Each trade’s side is inferred from whether it traded at the ask or the bid (or ticked up or down) between snapshots that arrive about once a second. It is useful for direction and disagreement with price, not as an exact tape.
Free during early access. We are opening it to traders in small batches.
Request early access